
FIBONACCI 1
This first exercise is pretty straightforward with the purpose of getting us used to the typographical format of the program. Things we had to keep in mind include, always including the * symbol when multiplying and carefully placing parentheses in the right places. My partner had two versions of this code. The first version is a straightforward method where everything is typical out as it is shown on the a piece of paper. For the second version, we set certain portions of the equation as variables. This made the code longer, but made our code less prone to mistakes with parentheses. Both gave us the correct answer of 55 when n = 10.


CAR UPDATE
For the next assignment, we were given the scenario of a rental car company with locations in Boston and Albany. Our task was to set up a program that would tell us how many cars would be in each location after one week. After day 1 there are 147 cars in Albany and 153 cars in Boston. In order to find the number of cars on the 4th week, you would just have to type car_update (the name of our program) into the function box four times.

CAR LOOP
In the next reading, we were told how to use for loops in MATLAB and then, tasked with using it in the rental car example from above. This was pretty straightforward, especially since we decided to just reference the old code instead of retyping everything! At week 52, we had a value of 118 cars in Albany and 182 cars in Boston.

CAR PLOT
In our continuation assignment regarding the rental cars, we were tasked with plotting the graph of this scenario. We graphed the location Albany as red circles ( although it looks weird in our first screenshot) and Boston as blue diamonds. We made plots with the initial number of cars as 150 and 10,000. The plots showed us that at week 20, the number of cars in each location plateaued, meaning that the same amount of cars are entering the leaving both cities every week from then on.

 |
| plot of i v. a |
 |
| plot of i v. a, b when n = 150 |
 |
| plot of i v. a, b when n = 10,000 |
FIBONACCI 2
For this next exercise, we created a loop to calculate for us the nth term of a fibonacci sequence given a recursive function.

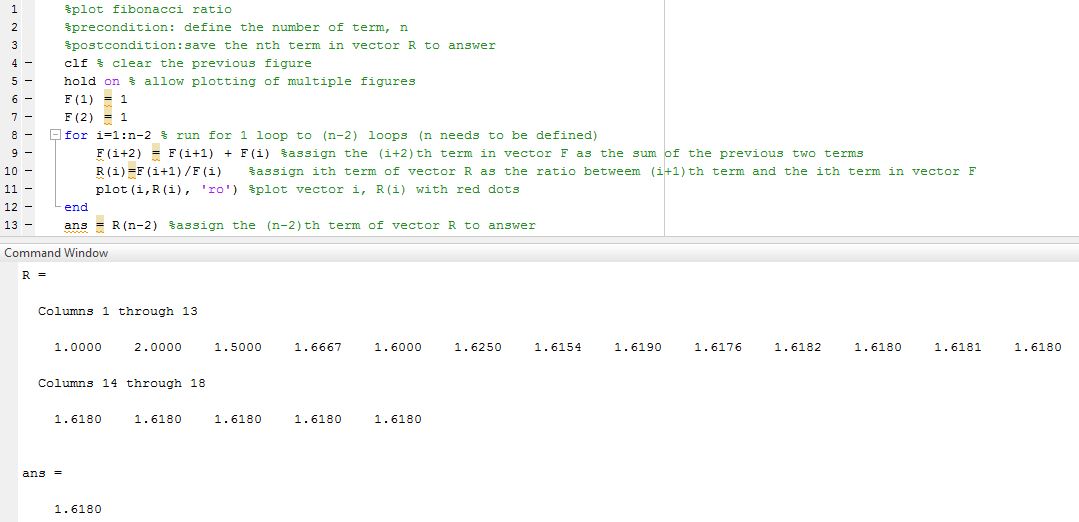
FIBONACCI RATIO
This exercise is a continuation of the one of above it and asks us to graph the ratio of F(i+1)/F(i). We made slight revisions in the names of our functions and how we numbered our loops and then we added in lines 10 and 11 to achieve our end result.
 |
| plot of i v. R(i) |
BASEBALL
For this exercise, we were tasked with finding the angle of the baseball being hit off the bat that would give us the largest horizontal distance. We were given a code to add on to which made things a lot easier. The first thing we did was to plug in random angles to get a better sense of what was going on. We came to the conclusion that the appropriate angle would be around 45 degrees. Then came the hard part. After a lot of trial and error, we ended up finding that the angle that would produce the biggest horizontal displacement was 44.


 |
| plot of x displacement v. y displacement for all angle values |

Love the GIF! and the incredible comments on everything
ReplyDelete